July 6, 2019
As a follow-up to the last Quantopian post, I added the following:
Of note, the mentioned trading strategy started scalable by design. I could push on its pressure points in order to increase the number of trades and the average net profit per trade. These were modulated. Most of it was done by leveraging and adding protective measures for when the equity line decreased by either reducing position sizes or going short.
The reengineered strategy mechanics were added to see how far I could push the outcome before it blew up for some reason or another. I have not reached that limit yet since there is still room to increase performance even further. Because the strategy is scalable, all I need to do is increase the leveraging a little bit more. The leveraging is compounding which leads to higher performance results over the long term. Evidently, there is a limit to this, but I have not pushed that far yet.
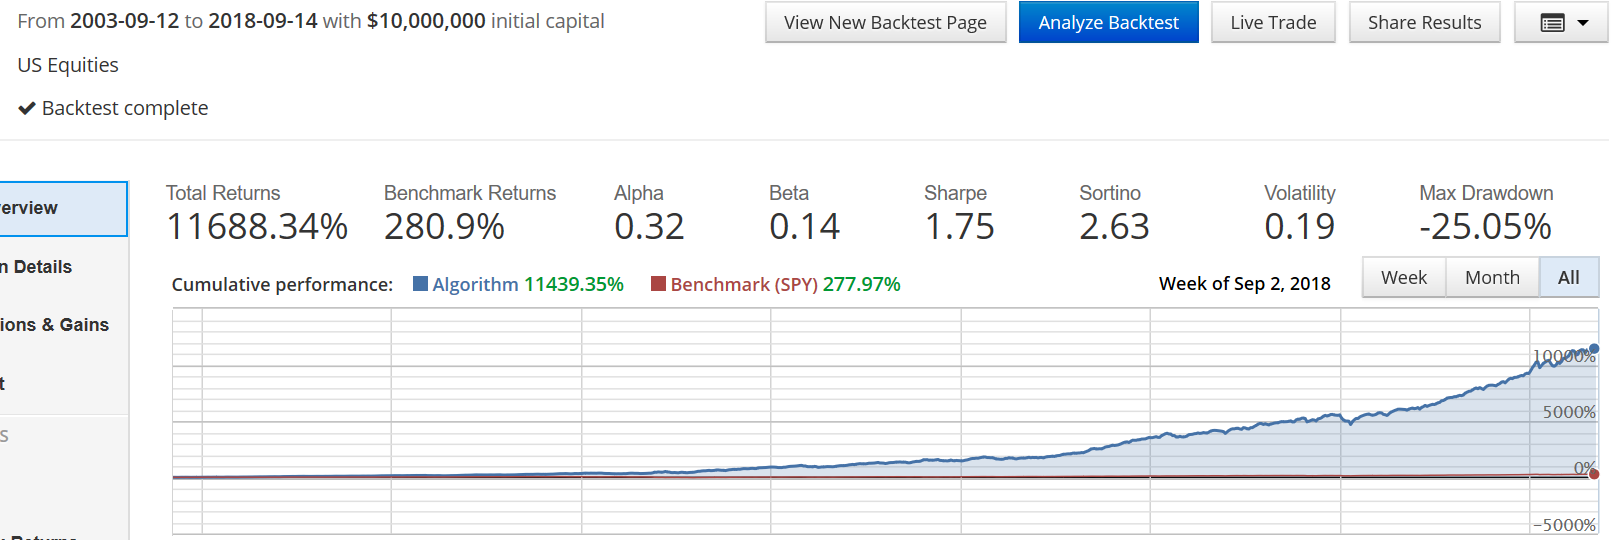
Notwithstanding, I also did the test of removing all the leveraging with the following results:
(click to enlarge)
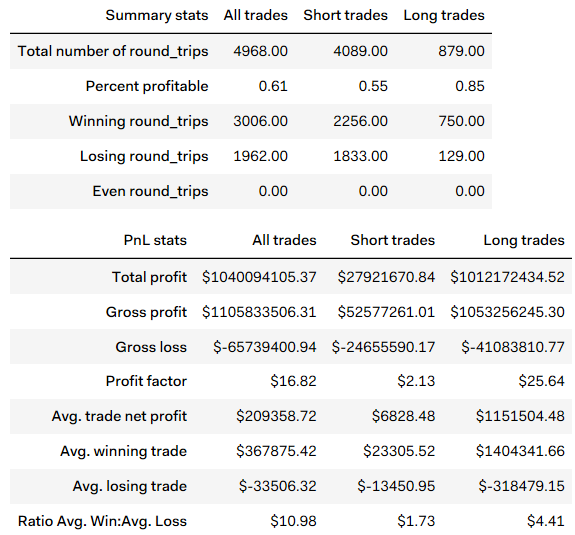
The above, compared to the last equity chart presented in my last post, does show the impact the leveraging had on the strategy's outcome. This did not affect the protective measures which stayed in place. However, this move showed that the high number of shorts were not there to make money, even if they did, but to protect the portfolio's downside, as illustrated in the following chart:
(click to enlarge)
Nonetheless, the strategy generated more trades simply due to its reduced bet size but still managed to be interestingly productive profit-wise.
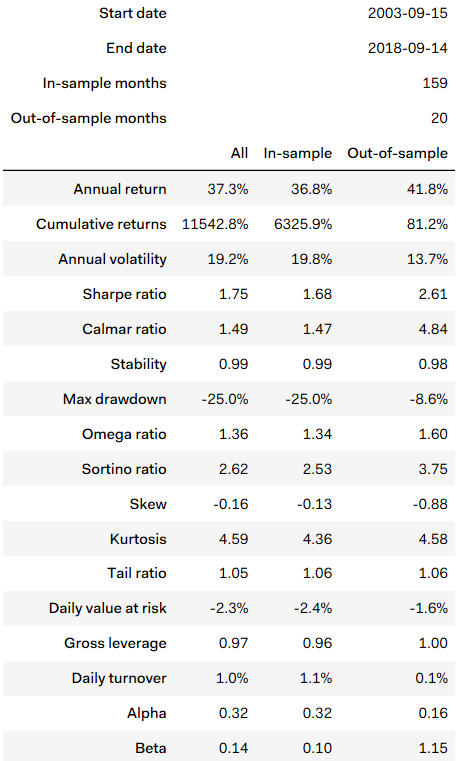
The more relaxed trade mechanics of the strategy can also be seen in the portfolio metrics as illustrated below:
(click to enlarge)
As expected, after removing the leveraging, gross leverage went down to 0.97. But this also had an impact on average volatility which went down to 19.2% while max drawdown also got lower to -25.0%. In all, interesting numbers. Portfolio stability is at 0.99, and the beta was down to 0.14.
If the theoretical CAPM expectation for a trading strategy is to get the long-term market average as in: E[F(t)] = r_f + β∙(E[r_m] – r_f), we should expect that with a beta of 0.14, we should not get there. At the very least, I should not be able to present the above numbers.
But that is the whole point of trading. It is as if we should not use the math of a buy-and-hold scenario and force it on a trading system that has its own mechanics and which will tend to recycle its ongoing profits as in this strategy. We should question the how and the why we force our programs to do things.
From these tests, I was able to push the performance limits due to the added trade mechanics, the protection measures, and the leveraging. Once I know the limits, which I have not attained yet, I could scale back to whatever level I felt more comfortable, with the notion that I could still apply pressure where I wanted to if desired, knowing that the strategy would support it. The whole process forced me to add better protective measures, which the strategy could benefit from even if no leveraging was applied.
Notice the value of the leveraging in this case. The leveraging added 24.6 times more profits than the no-leveraging scenario. And in numbers, it added $24.6B to the portfolio just because you scaled it up by using some leveraging. There would be more than enough to cover the leveraging fees.
Those are all choices we have to make. It is why we make these tests to see how far we can go, what are the mechanics of the trade, what is it you really want to do, and how much risk are you willing to take. One thing is sure, if you want more than your peers, you will have to do more than they do.
Created. July 6, 2019, © Guy R. Fleury. All rights reserved.


