
June 4, 2011
After the Livermore Challenge’s 2nd act, which made its point quite clear, there was only one question left open, and that was what about the other data set, the third data set, presented way back in the series. Again, there is only one way to know, and that is to run the test using the same script. So here it is:

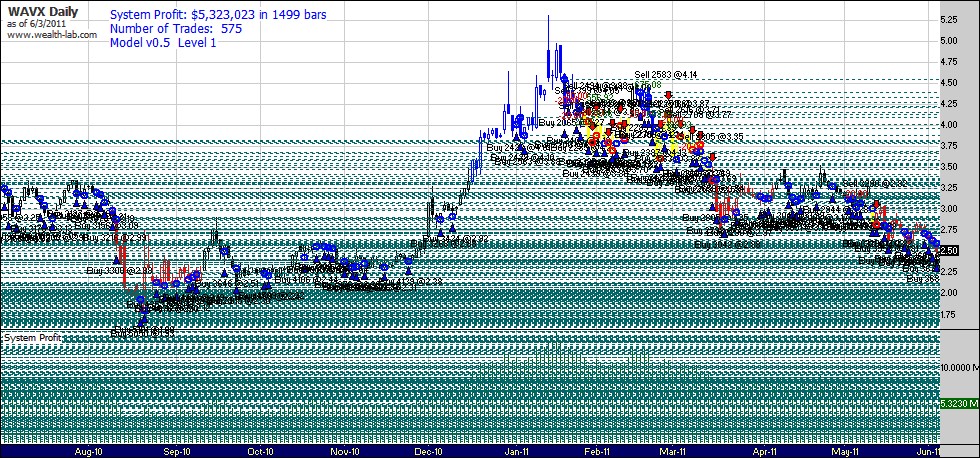
(click to enlarge)
The same kind of observations can be made as for the two previous tests on this same script. High profit-to-loss ratio. Relatively high compounded annual return. The sum of all stop losses amounting to about 1% of total profits.
You still don’t know what the future will bring. You still don’t know which stocks will outperform. You still don’t know how much profit any of the stocks will bring. But based on your preset trading behavior, you know what you are going to do when the price of the stock triggers one of your entry or exit points. You did pre-program your whole trading behavior from the start, after all.
It took me quite some time to develop this methodology and even more to verify to my satisfaction that it worked. A lot of time has been put into building the mathematical foundation that could explain the trading methodology. And now, even more time is being spent in the implementation phase. I see a progression in all these test results, and it points to even higher returns being possible.
(click to enlarge)
 |
 |
 |
 |
 |
 |
 |
 |
 |
 |
 |
 |
 |
 |
 |
 |
 |
 |
 |
 |
 |
 |
 |
 |
 |
 |
 |
 |
 |
 |
 |
 |
 |
 |
 |
 |
 |
 |
 |
 |
 |
 |
 |
( click to enlarge)
Created on ... June 4, 2011, © Guy R. Fleury. All rights reserved.