July 11, 2011
The following test is a little weird. For one, the script was developed in mid-April using a single stock: RIMM. This in itself should have a conclusion: over-optimized, curve-fitted to the extreme, and should, therefore, turn out to be just another script that falls down on its face when using different stocks.
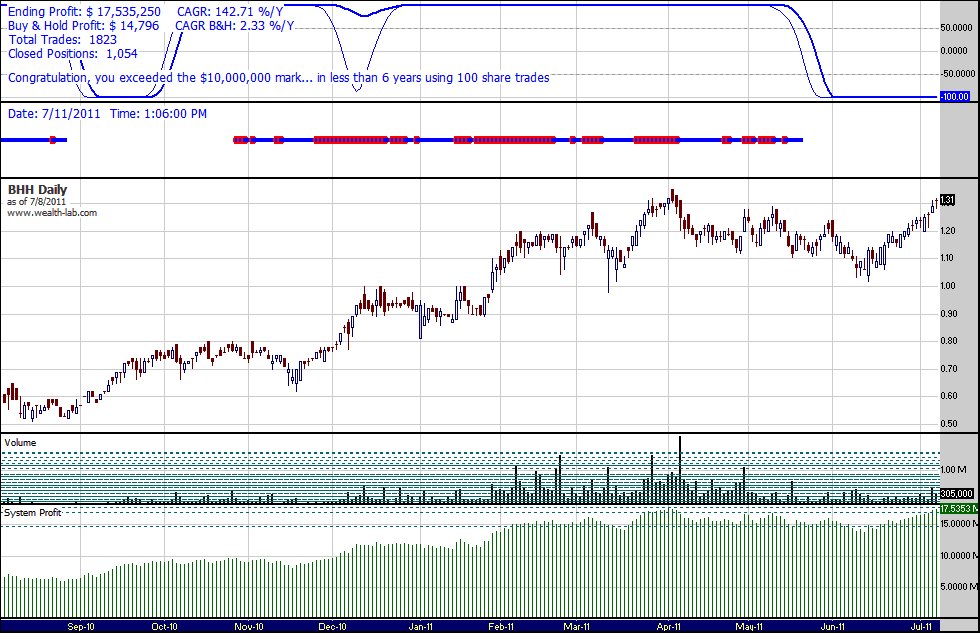
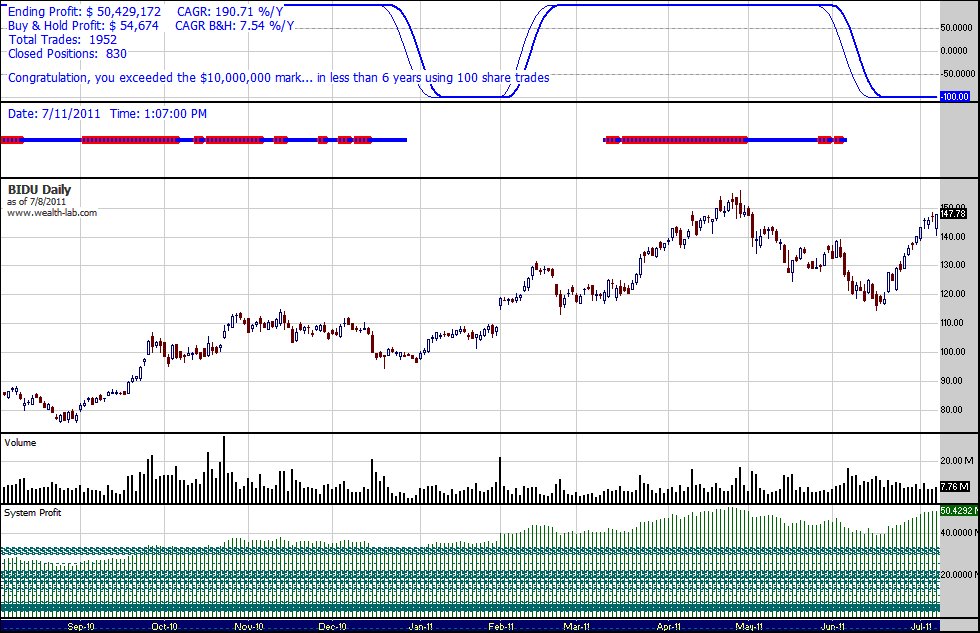
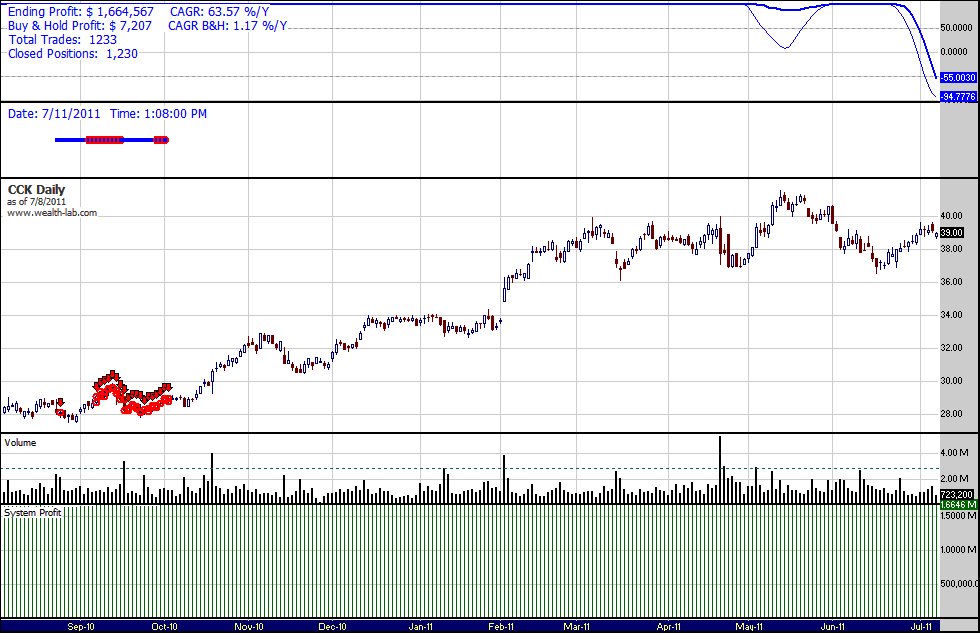
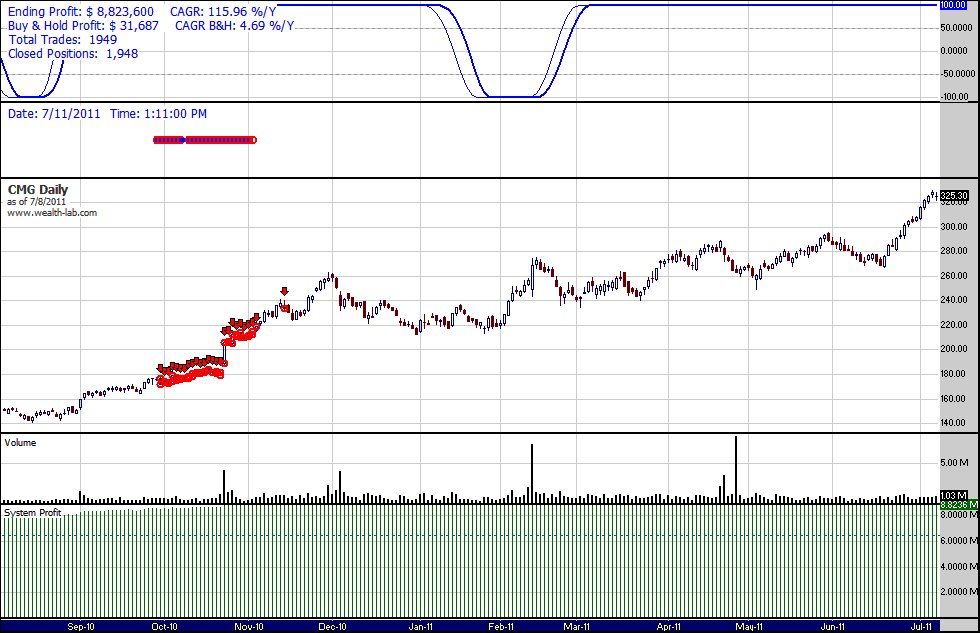
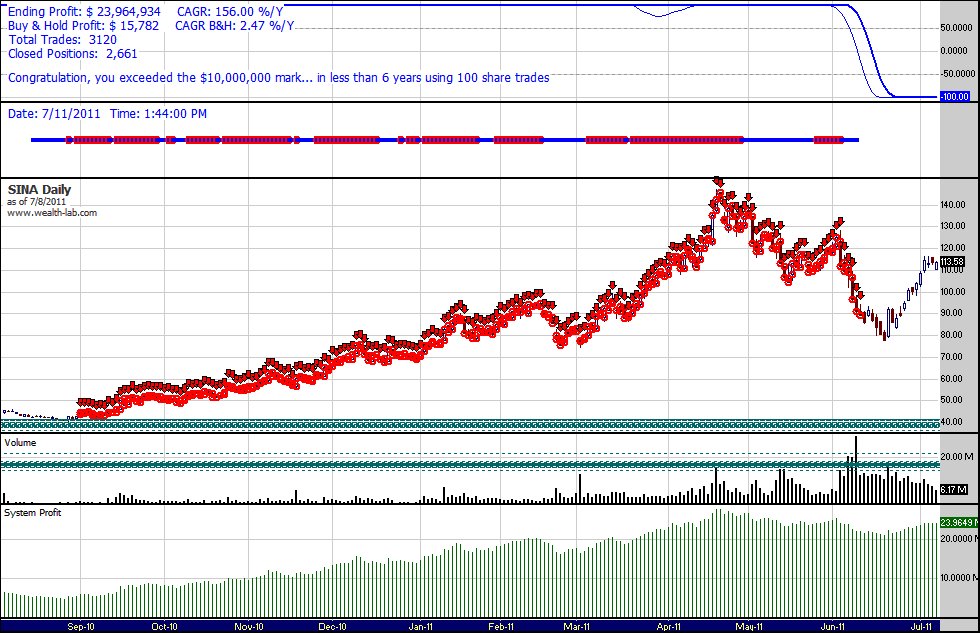
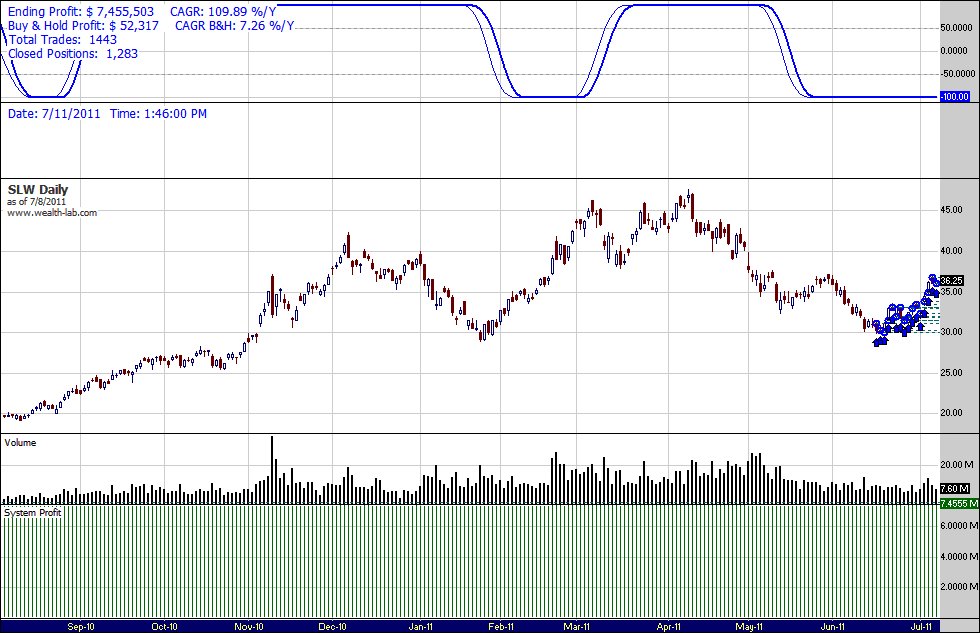
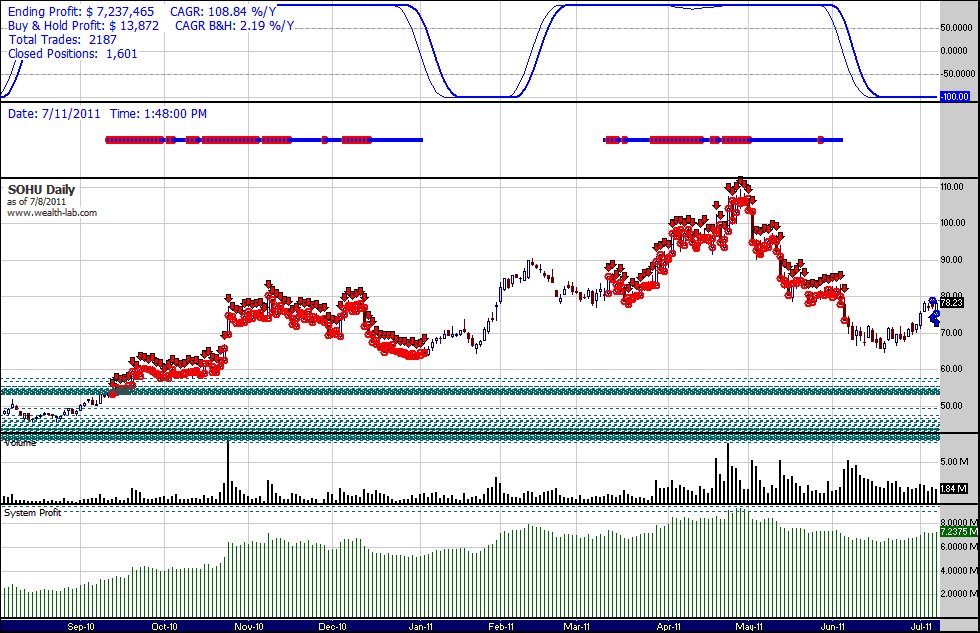
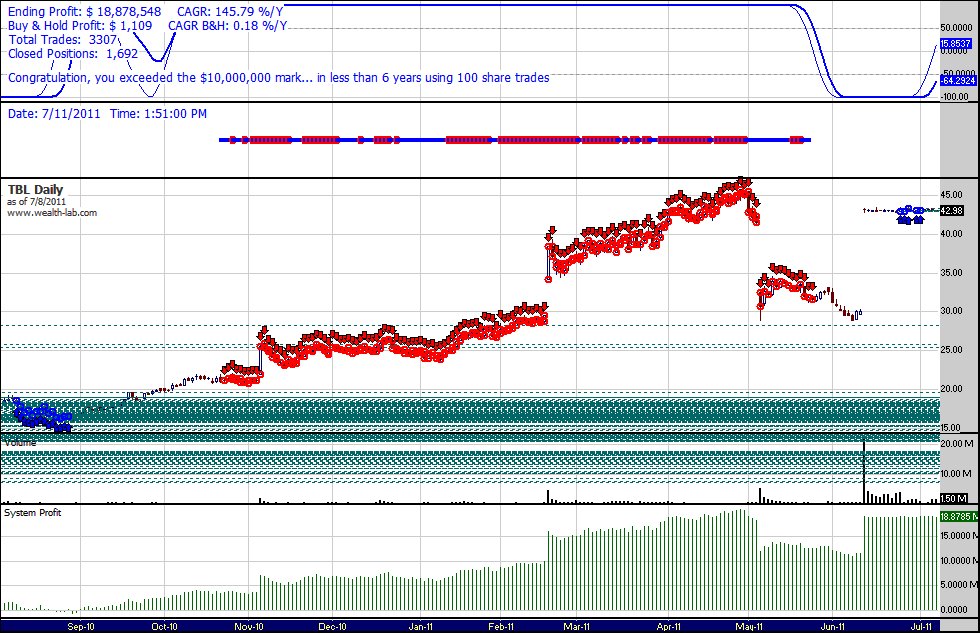
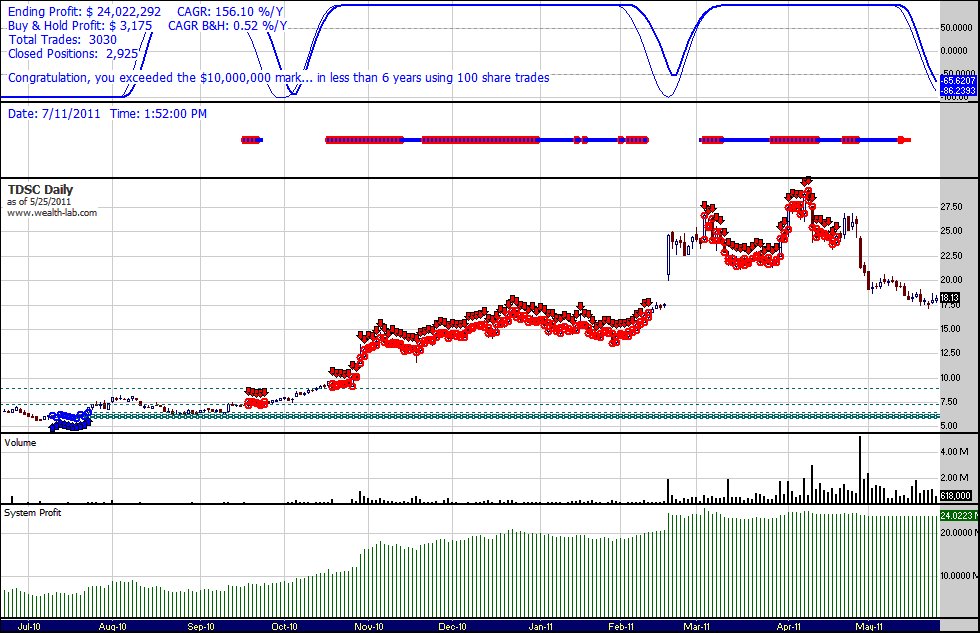
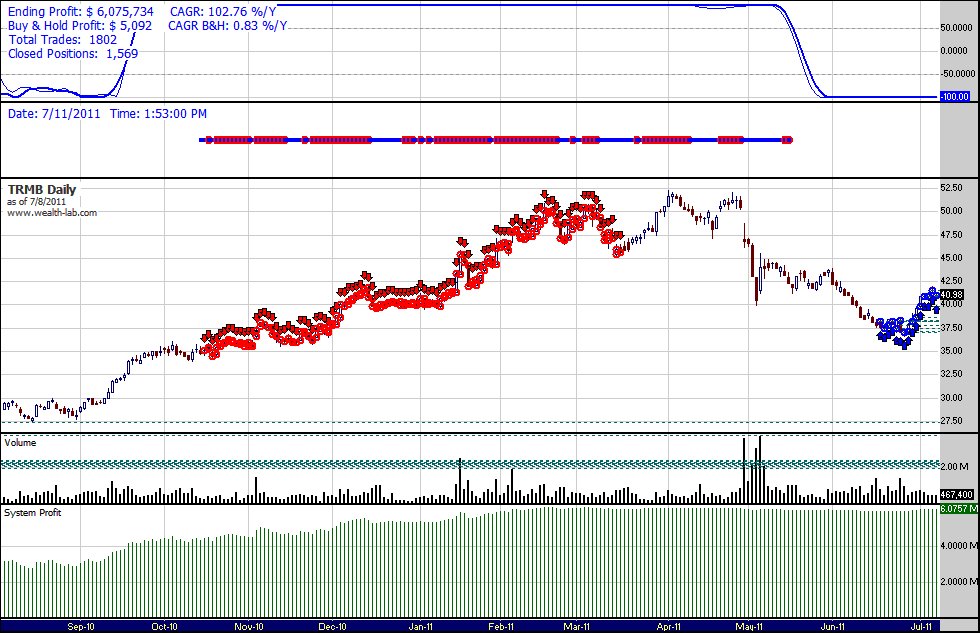
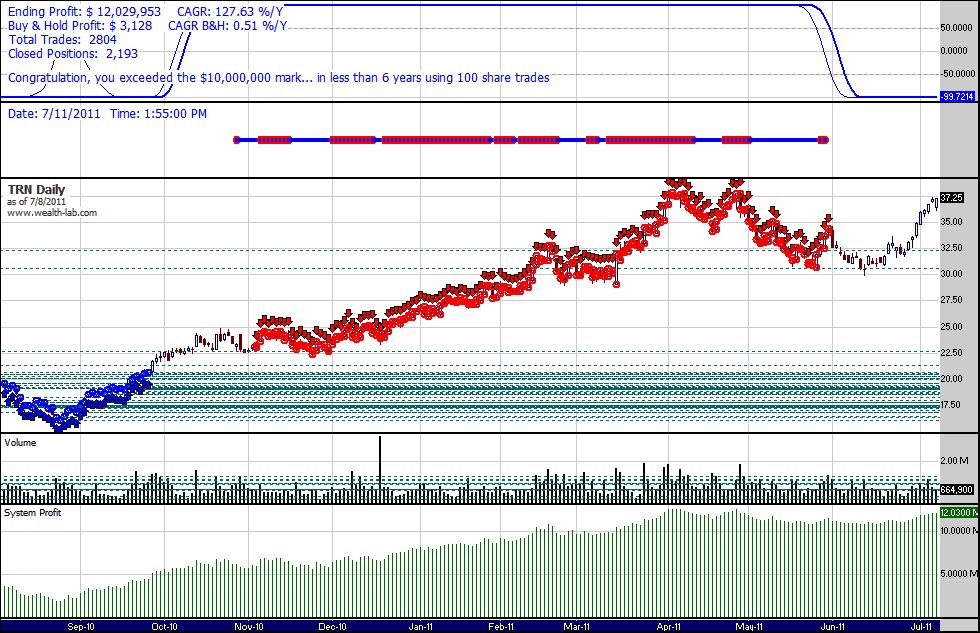
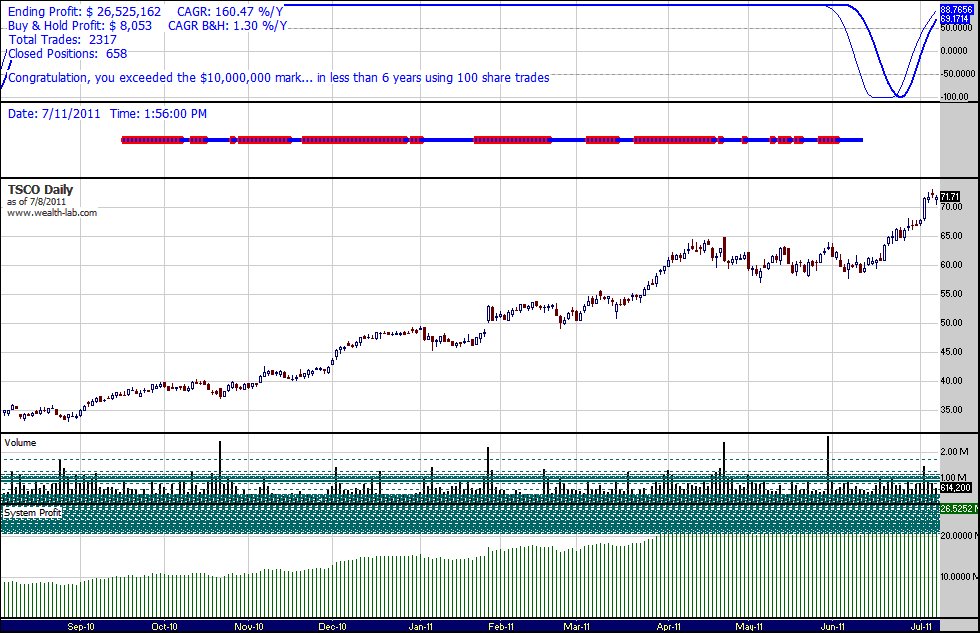
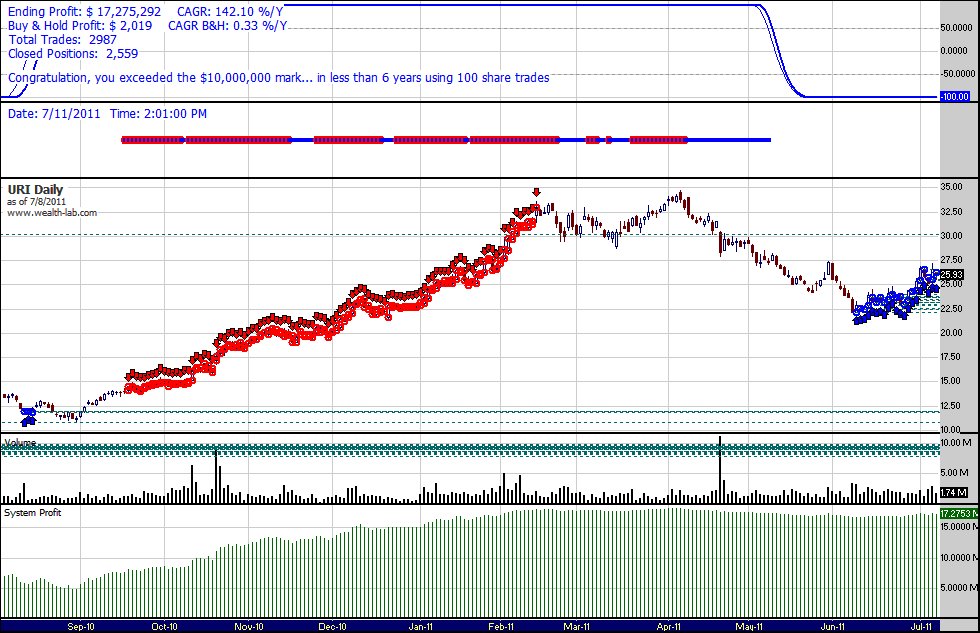
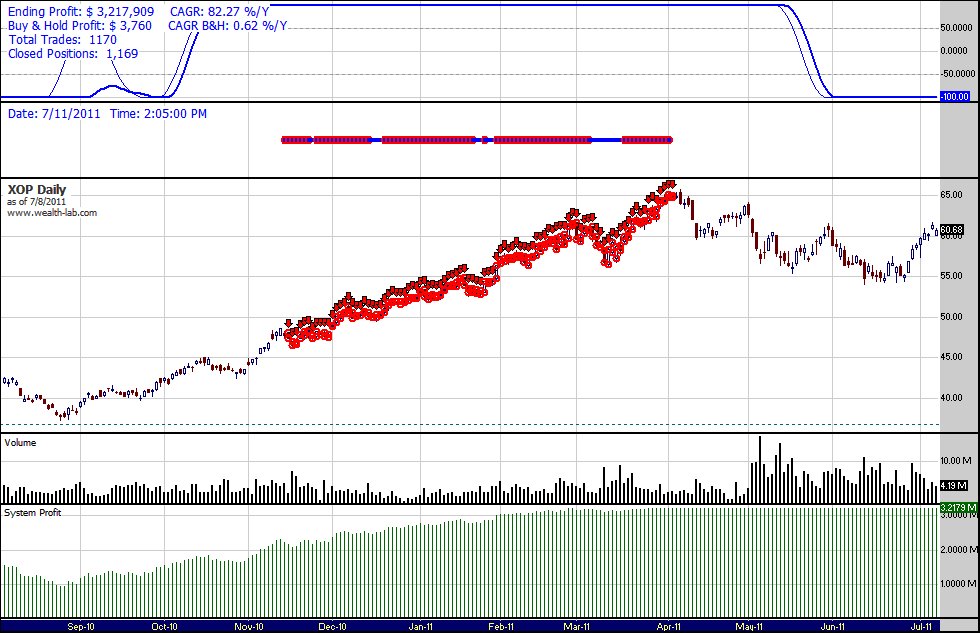
However, this script, in particular, does not use technical indicators per se. Trading goes through a decision surrogate, which will select price-relative trades based on the state of a moving trading window.
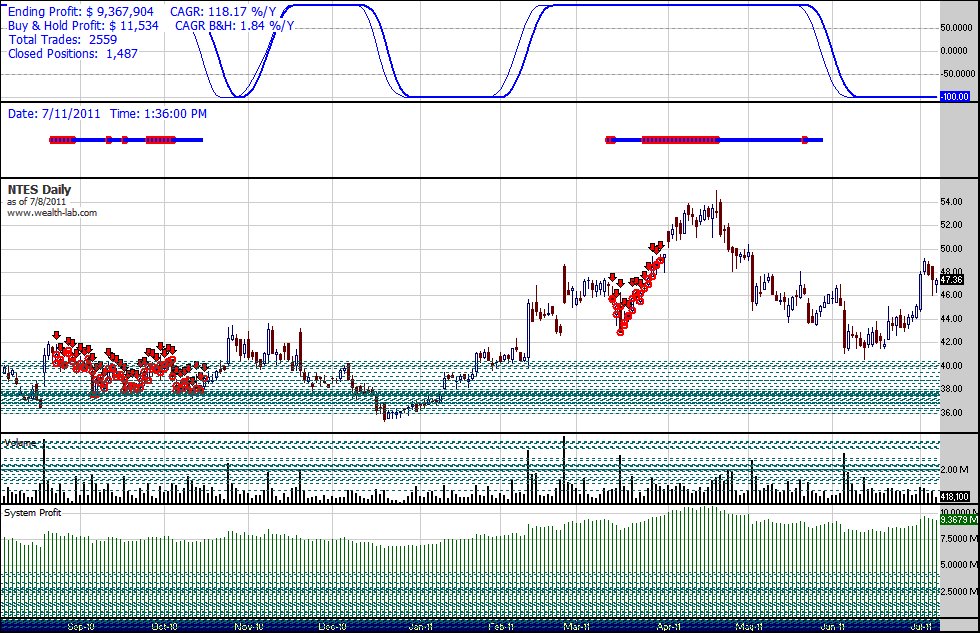
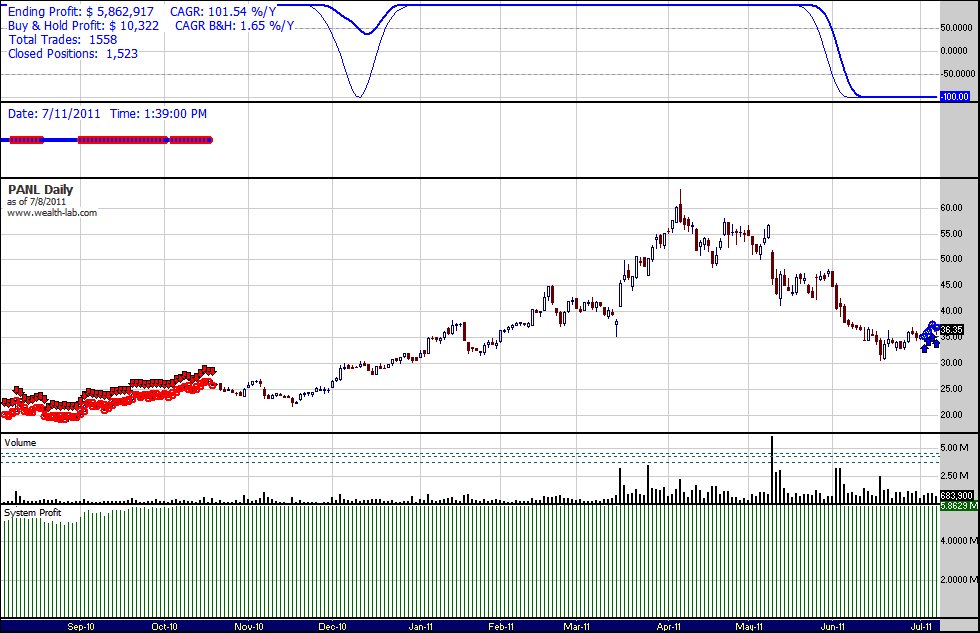
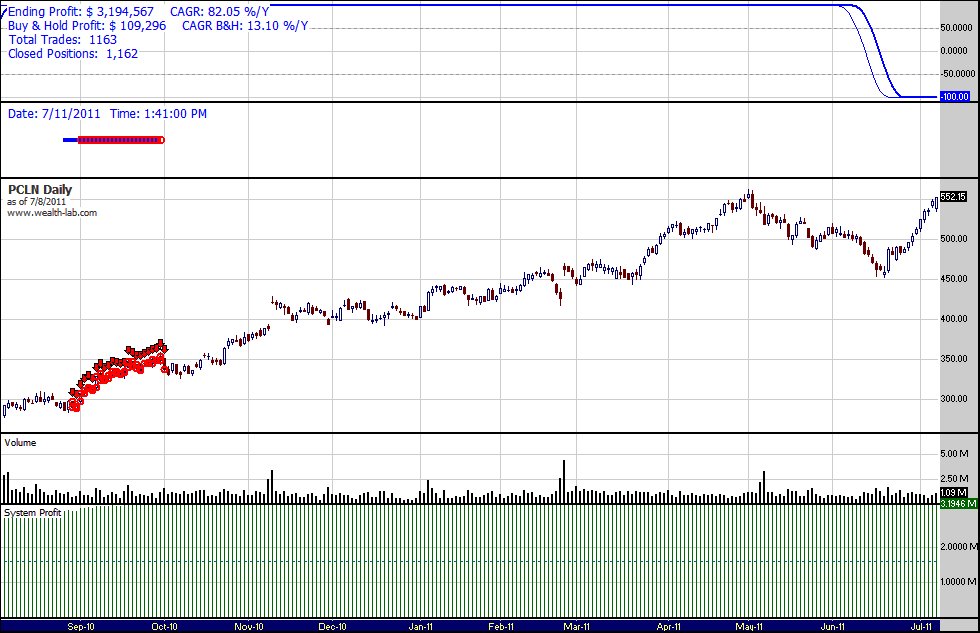
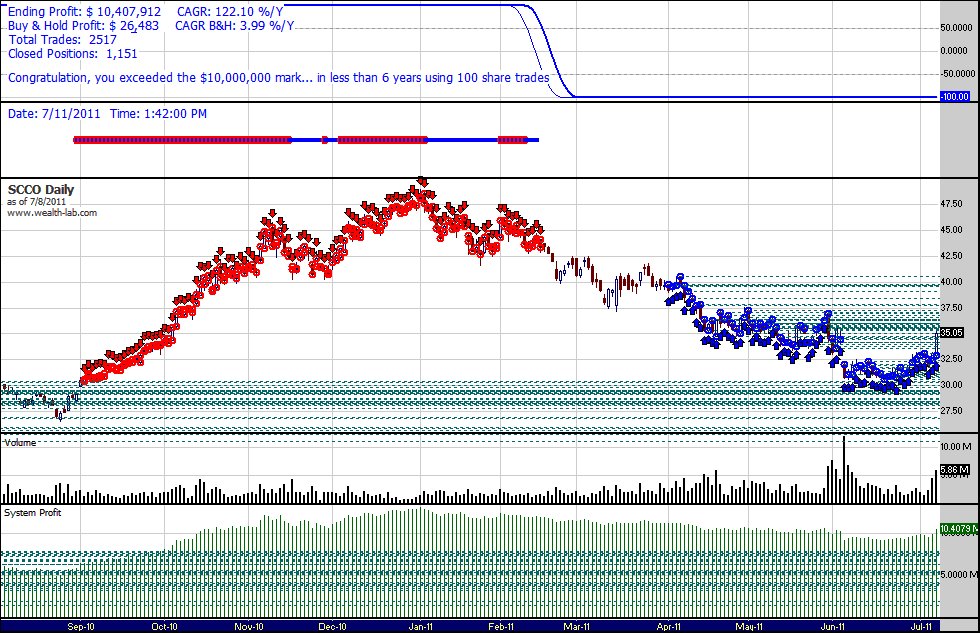
The trading window has only 3 states: buy, sell, or hold, and is very insensitive to market noise. In its buy state, you accumulate shares following the decision surrogate’s whims. In its sell state, shares can be sold as long as the sell window is open. As for the hold state, it is viewed as a transitional period where nothing is supposed to happen.
The script does not make any price prediction and will sell all its holdings if the price is right; even though the price might keep going up. (I will try to improve on this one). All in all, you can not predict what this script is going to do on a particular stock as it appears totally path-dependent; it goes its own way. At times, you would sell, and at others, not, but when viewed at the portfolio level, using over-diversification, as in all my trading methods, it shines.
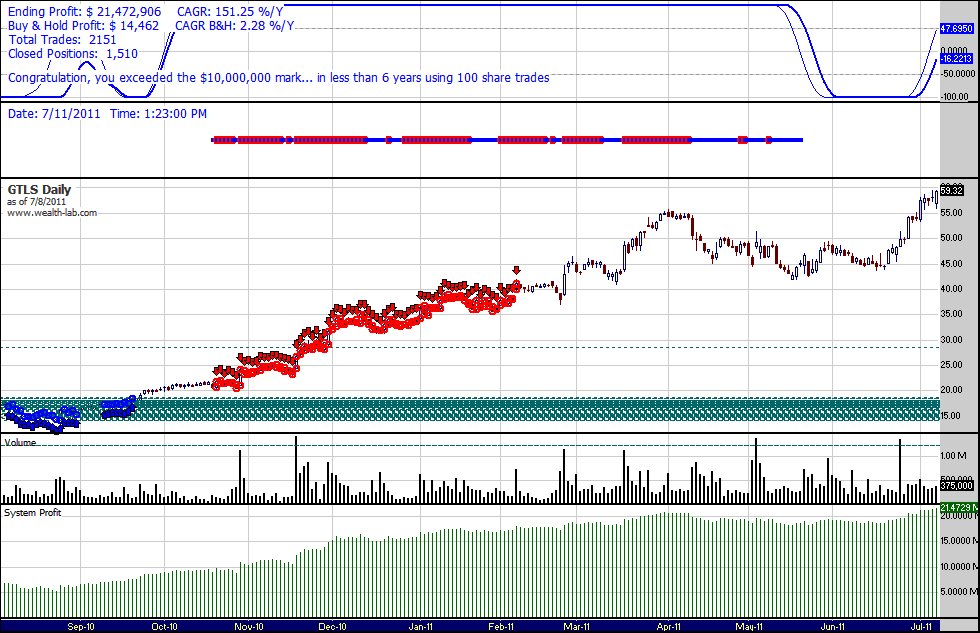
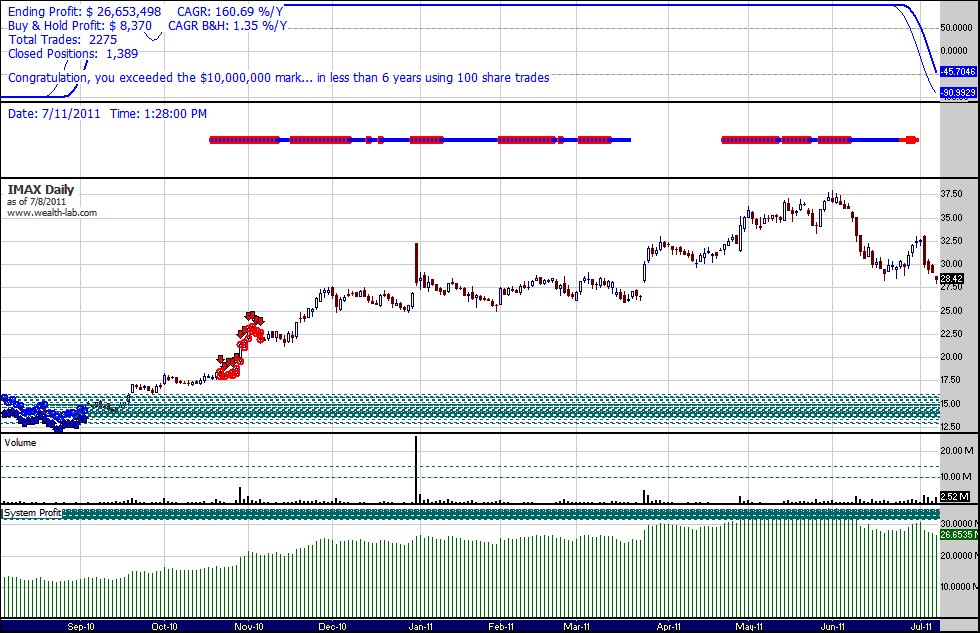
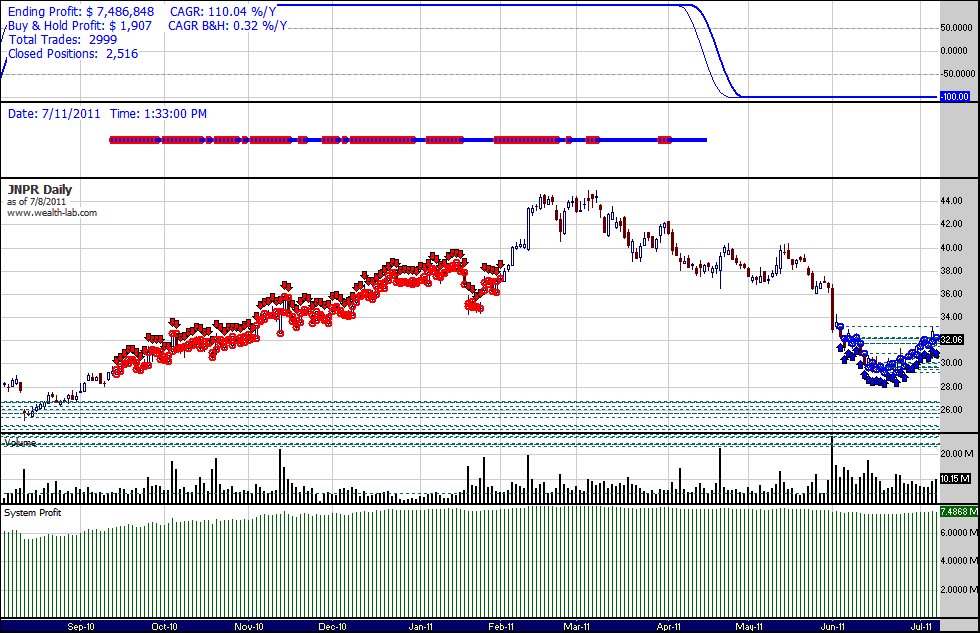
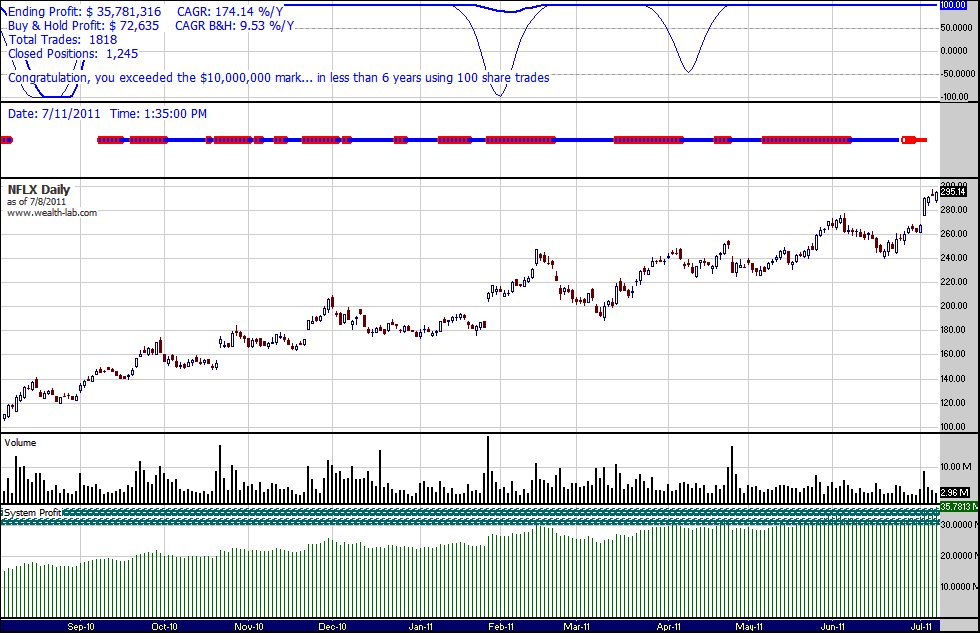
You won’t know exactly what is happening except in general terms like the script is on a buying or selling spree. It will time slice and quantity dice its entries and exits.
The performance table below is the outcome of this script’s first visit to the same stocks as in the first batch tested. I usually need a basis for comparison, and what better choice than a list of stocks that the script has never seen and that has the advantage of having been tested on other scripts?
Performance Table: Trading Method ADD3 v1.7
(click to enlarge)
Tested July 11, 2011
Some observations worth noting on the performance table:
• on average, an over 82% hit rate
• over the 5.83 years simulation period; an over 135% portfolio return
• total loss due to all portfolio stop losses less than 3.5% of total profits
• the method can easily be automated
I will certainly go back to this script and study its behavior more closely. It does, in my opinion, have desirable portfolio attributes.
(click to enlarge)
 |
 |
 |
 |
 |
 |
 |
 |
 |
 |
 |
 |
 |
 |
 |
 |
 |
 |
 |
 |
 |
 |
 |
 |
 |
 |
 |
 |
 |
 |
 |
 |
 |
 |
 |
 |
 |
 |
 |
 |
 |
 |
 |
( click to enlarge)
Created on ... July 11, 2011, © Guy R. Fleury. All rights reserved.

